 PriceWire
Win rate is not profitability.
Four small examples show why the size of a win, the size of a loss and the cost of trading belong beside every win-rate claim.
A win rate counts how often an outcome is positive. It does not tell us how large the positive outcomes are. Consider ten hypothetical trades: six win 100 units each, four lose 150 units each, and every round trip costs 10. Wins add 600; losses subtract 600; costs subtract another 100. The net result is −100 units despite six winning trades.
This is an arithmetic example, not a backtest. There is no security, exchange, historical price series or claim about a tradable edge behind it.
Hold the assumptions where readers can see them
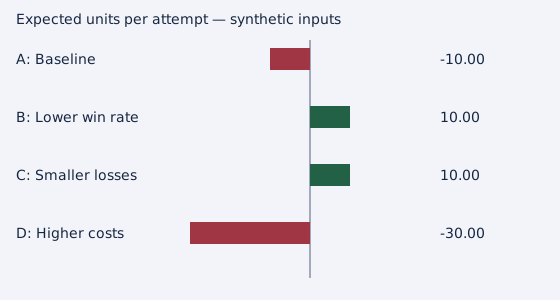
For a two-outcome model, expected result per attempt is p × gain − (1 − p) × loss − cost. Here, gain and loss are before costs; cost is paid once per completed round trip. If your inputs are already net of costs, subtracting them again double-counts them.
| Scenario | Win rate | Gain | Loss | Cost | Expected result | Break-even rate |
|---|---|---|---|---|---|---|
| A: Baseline | 60% | 100 | 150 | 10 | -10.00 | 64.0% |
| B: Lower win rate | 40% | 200 | 100 | 10 | 10.00 | 36.7% |
| C: Smaller losses | 60% | 100 | 100 | 10 | 10.00 | 55.0% |
| D: Higher costs | 60% | 100 | 150 | 30 | -30.00 | 72.0% |
The threshold moves with the payoffs
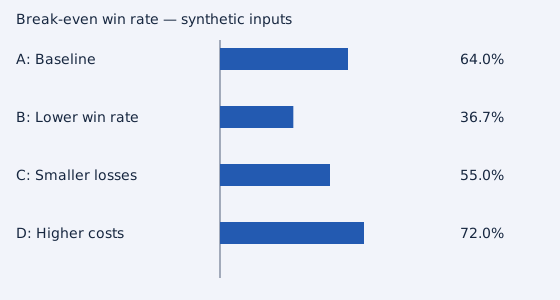
Setting expected result to zero gives a break-even win rate of (loss + cost) / (gain + loss). The baseline needs 64.0%, not 50%. Scenario B needs about 36.7% because its gains are twice its losses before costs. Scenario C keeps the baseline win rate but reduces the loss size. Scenario D changes only costs, pushing break-even to 72.0%.
What the equation leaves out
An expectation is not a promised sequence of outcomes. Ten real trades need not contain exactly six wins. Losses may cluster; average losses may hide rare, much larger losses. Market conditions, execution and position sizes can change. This example has no uncertainty estimate, compounding, financing, taxes, liquidity constraints or ruin model. Its purpose is to show what information a win rate omits.
Before applying the equation to observations, state how trades were selected, whether outcomes are net of costs, how missing records were handled, and whether sizing changed. Keep a separate sample for evaluating a rule chosen on earlier data. A positive number calculated from invented inputs is not evidence of performance.
Reproduction and editorial use
Source: original PriceWire synthetic scenarios. Formula derived above; no third-party data. The delivery sample contains editable text, the CSV, both SVGs and reproduce.py. Numerical checks use decimal arithmetic. Prepared with AI assistance; no external peer review is claimed.
Use the calculator to reproduce each row. This sample may be quoted or republished with PriceWire attribution and the synthetic-data labels intact; the complete terms travel with its delivery files. See the publisher pilot scope.